Genius: HikingArtist.com
PowerPoint is so despised that “death by PowerPoint” has become a common expression. It might be more literal than you think given its role in the explosion of the Columbia shuttle and its negative impact on the conduct of war. Even the creators of PowerPoint don’t like how it’s used today.
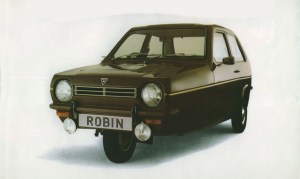
If PowerPoint was a car.
Yet PowerPoint has its defenders. Many argue that users can build good presentations with it if they know how to use it properly.
Fine, but that does not make it any less evil. In fact, it is at the root of why PowerPoint is evil:
It is designed to create bad presentations by default.

If PowerPoint was a coffee mug.
That is, to create a good presentation, you have to avoid the pitfalls that PowerPoint puts in your way.
For people who are so sensitive to design, I am surprised that presentation professionals do not level this criticism more often at PowerPoint. They know that a presentation design helps the audience understand the right messages. It is Microsoft’s job to design PowerPoint so that users will stumble upon good presentation practices.
If PowerPoint was a software. Oh, wait…
(For an example of how software design can make good people do bad things, see the initial comments of Stephen few on Tableau 8.)
Let’s go through a few basic features of the PowerPoint interface (2011, the latest for Mac) and how it contradicts professional advice on how to make good presentations. I’ll even make some constructive suggestions.
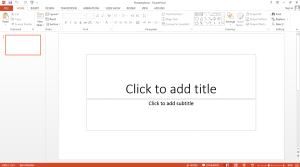
The first screen
A face only a mother could love.
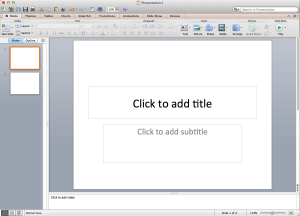
Click on the familiar red icon and you’ll get this welcome screen. It invites you to type the title of your presentation, as if you knew at the beginning. It also makes you feel inadequate if you don’t have a subtitle. Can you imagine Word starting by telling you what part of your text you need and should write first?
Solution: Present an interface that encourages the user to develop their story first. Unfortunately, PowerPoint has become the first thing that people open when they have a presentation to prepare. Deal with it. Instead of starting with a slide, what about starting with some story-making interface where people would be able to note down their points and rearrange them, like post-its? In the meantime, make the speaker’s notes section much more prominent so that users write down all that crosses their mind there, rather than in their slides.
Slide layout options
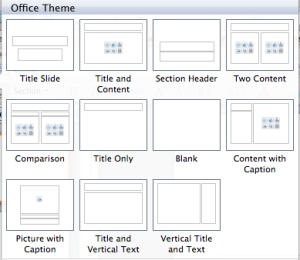
Choice paralysis? You might be a good presenter.
The very first icon in the very first ribbon encourages you to add slides and to choose layout options for them. Let’s look for one of the best options: a full screen picture. There? No. There? Nope. Hum. There? Non. Oh well: It doesn’t exist.
Solution: Check out the layout options of the Apple Aperture photo albums. They look like good presentations by masters like Garr Reynolds. Full size images, big titles. Why is it that PowerPoint does not have a single such layout?
Title and content slide
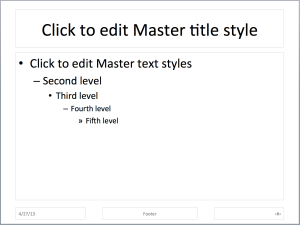
A well-known hierarchy: dot, dash, dot, dash, French quotation mark.
The bullet points! The dreaded, overused bullet points, the staple of lists without hierarchy, of paragraphs to read while a speaker speaks, of half-formed ideas on printed decks — it’s what PowerPoint suggests you should be using in its bread-and-butter slide. It gets worse: when entering text, hit tab and you go down one level, with a random choice of “em dash” as the next thing after “round bullet” (who died and made the round bullet king?) and… reduces text size! Take that, large and sparse text. Hey user, why don’t you just fix that yourself since we all know it’s bad form anyway?
Solution: Do not put bullet by defaults. If a user needs them, they are at the exact same place as in Word. Make users work just a little for doing the wrong thing.
Text auto-resize
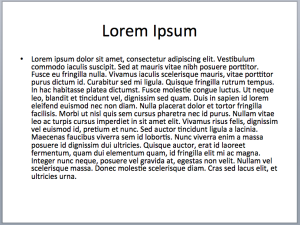
Mucho dolor, indeed.
PowerPoint gets you started with a fairly large text size: 32 points. Good: this is in line with the advice to limit the amount of text on your slides. But what happens when you write more than a text box can contain? PowerPoint takes no offense, in fact it takes care of the problem by automatically reducing the size of your text!
How is that supportive of restraining the number of words on a slide? How is this not a temptation, a signal to the user that there’s no point in limiting the amount of text? That’s the source of the slideument, right there.
Solution: No more text auto-resize. When a user puts too much text on a slide, it should have to manually override the software.
Themes
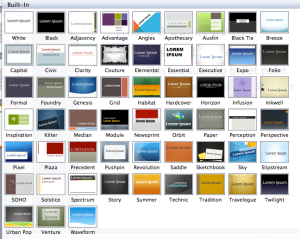
Which of these themes look good to you? Maybe better not to answer.
Microsoft ran a competition to find the ugliest themes possible. Is there another explanation? (Would “Couture” mind getting out of the way please so that we can add some content?) Maybe they asked their software engineers to design the themes. Or Steve Ballmer.
Solution: Include elegant, restrained but also relevant themes. Call the black and white one “Brightly lit room”. This might even suggest to the user that a good presenter knows in advance what the room looks like.
Images
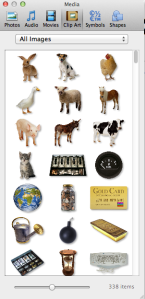
Help me choose between the bomb and the hourglass.
PowerPoint is a visual aid, so this has to be good. Kudos to Microsoft: nearly half of their layout options propose a direct link to pictures. And double kudos because it links to your own photo library, which might not look professional but are surely original.
On the other hand, there is no link to a professional photography website, such as Corbis or iStockPhoto. There is, however, a link to their breathtaking (as in “taking the life out of you”) clip arts. Seeing a Microsoft clip art in a presentation has become a reminder that you’re not following your dreams.
Solution: Give good habits to your users and offer access to 20 free photos with each copy of MS Office, in partnership with a professional photo company. Heck, Microsoft, Bill Gates owns Corbis. Hint, hint!
Charts
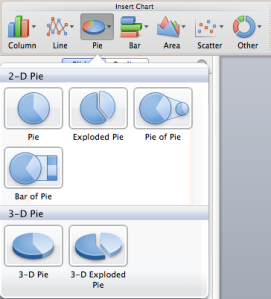
I lost my appetite.
PowerPoint uses the Excel charts and all Excel defaults are wrong. It glorifies the pie chart and proposes 3D versions of just about every chart. Fixing Excel charts can be a full time job and a profitable one at that. How can we blame the casual users for using the most accessible designs?
Solution: Fix Excel charts. The 2013 version seems like a step in the right direction, although I haven’t used it. But that’s for another post.
Well well
MS Word has not corrupted writing. Maybe it has to do with a blank page and a series of fairly relevant tools. If Word was designed like PowerPoint, the text would be all caps by default, the first page would ask you the title of your book and you’d have three bullets waiting for you.
Let’s not defend a bad tool. Let’s ask Microsoft for a tool with the right affordances. The interaction of users and their tools is critical to the outcome. Audiences deserve better than the duo amateur-PowerPoint.

 If you’re looking online for a data visualization training, it’s likely you’ve come across Cole Nussbaumer. That’s what happened to me when I registered for what turned out to be her very first public workshop, after years of teaching at Google and to other organizations. She describes her views and teachings in various articles, but here she’s agreed to speak more about her personal journey and what she observed from her clients.


